

Troubleshooting DRBD Performance Issues
DRBD® can only perform as fast as its slowest component among the Network and Disk subsystems in terms of bandwidth and latency. If write performance is less than expected, isolating and troubleshooting each separately can help identify an issue.
To know you have a performance issue or bottleneck in your DRBD cluster, you must first know what performance to expect from the underlying hardware. The simplest way to do this is by benchmarking the storage and networks used by DRBD before they’re put in production.
There are various tools and methods available to benchmark network
throughput and latency. Obtaining the maximum throughput can be
accomplished using iperf2 (or the newer iperf3) utility, or you can use
more common tools like dd and netcat if you already have them installed.
See the KB entry on benchmarking using iperf, or dd and netcat:
https://kb.linbit.com/benchmarking-network-throughput
The following ping command can be used to quickly gather the average
round trip latency between hosts (1.087 is the average in the last line
of output from my slow test network):
# ping -M do -s 1472 -I enp0s8 -c 5 192.168.222.42
PING 192.168.222.42 (192.168.222.42) from 192.168.222.40 enp0s8: 1472(1500) bytes of data.
1480 bytes from 192.168.222.42: icmp_seq=1 ttl=64 time=1.24 ms
1480 bytes from 192.168.222.42: icmp_seq=2 ttl=64 time=0.993 ms
1480 bytes from 192.168.222.42: icmp_seq=3 ttl=64 time=0.877 ms
1480 bytes from 192.168.222.42: icmp_seq=4 ttl=64 time=1.02 ms
1480 bytes from 192.168.222.42: icmp_seq=5 ttl=64 time=1.30 ms

--- 192.168.222.42 ping statistics ---
5 packets transmitted, 5 received, 0% packet loss, time 4009ms
rtt min/avg/max/mdev = 0.877/1.087/1.302/0.160 ms
-Mdo tellspingnot to fragment pings into multiple packets.-
-s 1472sets the packet size in bytes, if you’re using normal/default frame sizes on your network, 1472 will fit into the 1500 byte limit (with room for IP and ICMP headers). If your network supports jumbo frames, up to 8972 will fit into a single packet. -Isets the interface to ping from.-c 5sets the number of pings to send before exiting (more is always better for statistics).
With throughput and latency tested, you should have an understanding of what the network is capable of.
Most if not all benchmarking tools for block storage are destructive to the data living on them. For that reason, it’s best to collect benchmarks before putting the storage into production. However, if you’ve used LVM to back DRBD, or for some reason have saved room for an extra partition on your block device, you may be able to create a new logical volume or partition to obtain benchmarks without destroying data.
⚠️ WARNING: DO NOT PROCEED TO BENCHMARK PRODUCTION STORAGE!
For benchmarking sequential throughput it’s easiest to use the dd utility. When complete, it will output the throughput in Bytes per second.
# dd if=/dev/zero of=/dev/drbdpool/test0 bs=4M count=100 oflag=direct
100+0 records in
100+0 records out
419430400 bytes (419 MB, 400 MiB) copied, 0.126401 s, 3.3 GB/s
if=/dev/zerois the device we’ll dump data from (/dev/zero is fastest, as it’s all null data).of=/dev/drbdpool/test0is the backing disk for my DRBD device (disk setting in the DRBD config).bs=4Mis the block size, which is set very large for our test.count=100is the number of blocks of the specified size to write for out test. Verify that the bs * count isn’t larger than your device.oflag=directtells dd to skip system buffers. You want to test the disk performance, not the system memory.
Use this method to benchmark each disk in your DRBD cluster, as it only takes one disk in a synchronously replicated cluster to bottleneck the performance of the entire cluster.
For random writes it’s better to examine IOPS than throughput. While other utilities exist, the FIO utility is very robust, open source, and what you will use in the following example. The documentation for FIO can be found here: https://fio.readthedocs.io/en/latest/fio_doc.html
# fio --name fio-test --filename /dev/drbdpool/test0 --ioengine libaio \
      --direct 1 --rw randwrite --bs 4k --runtime 30s --numjobs 4 --iodepth=32 \
      --group_reporting --rwmixwrite=100

fio-test: (g=0): rw=randwrite, bs=(R) 4096B-4096B, (W) 4096B-4096B, (T) 4096B-4096B, ioengine=libaio, iodepth=32
...
fio-3.19
Starting 4 processes
Jobs: 1 (f=1): [w(1),_(3)][81.8%][w=212MiB/s][w=54.3k IOPS][eta 00m:02s]
fio-test: (groupid=0, jobs=4): err= 0: pid=806822: Wed Feb  2 21:43:25 2022
  write: IOPS=57.3k, BW=224MiB/s (235MB/s)(2016MiB/9001msec); 0 zone resets
    slat (nsec): min=1403, max=142143k, avg=57657.41, stdev=617874.17
    clat (nsec): min=1028, max=401706k, avg=1892851.78, stdev=6991309.35
     lat (usec): min=31, max=401710, avg=1950.74, stdev=7153.24
    clat percentiles (usec):
     |  1.00th=[   482],  5.00th=[   807], 10.00th=[   996], 20.00th=[  1074],
     | 30.00th=[  1172], 40.00th=[  1319], 50.00th=[  1352], 60.00th=[  1385],
     | 70.00th=[  1401], 80.00th=[  1450], 90.00th=[  1565], 95.00th=[  1909],
     | 99.00th=[ 15139], 99.50th=[ 33162], 99.90th=[116917], 99.95th=[154141],
     | 99.99th=[229639]
   bw (  KiB/s): min=61928, max=443048, per=100.00%, avg=264695.57, stdev=30365.90, samples=58
   iops        : min=15481, max=110763, avg=66172.61, stdev=7591.51, samples=58
  lat (usec)   : 2=0.01%, 4=0.01%, 10=0.01%, 20=0.01%, 50=0.14%
  lat (usec)   : 100=0.11%, 250=0.28%, 500=0.51%, 750=1.03%, 1000=8.02%
  lat (msec)   : 2=85.37%, 4=2.22%, 10=1.02%, 20=0.49%, 50=0.50%
  lat (msec)   : 100=0.19%, 250=0.12%, 500=0.01%
  cpu          : usr=1.24%, sys=60.86%, ctx=7649, majf=0, minf=60
  IO depths    : 1=0.1%, 2=0.1%, 4=0.1%, 8=0.1%, 16=0.1%, 32=100.0%, >=64=0.0%
     submit    : 0=0.0%, 4=100.0%, 8=0.0%, 16=0.0%, 32=0.0%, 64=0.0%, >=64=0.0%
     complete  : 0=0.0%, 4=100.0%, 8=0.0%, 16=0.0%, 32=0.1%, 64=0.0%, >=64=0.0%
     issued rwts: total=0,516096,0,0 short=0,0,0,0 dropped=0,0,0,0
     latency   : target=0, window=0, percentile=100.00%, depth=32

Run status group 0 (all jobs):
  WRITE: bw=224MiB/s (235MB/s), 224MiB/s-224MiB/s (235MB/s-235MB/s), io=2016MiB (2114MB), run=9001-9001msec
--name fio-testis the arbitrary name of the test run.--filename /dev/drbdpool/test0is the block device we’re testing. This could be set to run against a file on a filesystem as opposed to a raw block device).--ioengine libaiosets the IO engine FIO will use to libaio, which is suitable for direct/unbuffered IO (which we also set in the example command).--direct 1tells FIO to skip system buffers to ensure we’re testing the disk and not the system memory.--rw randwritesets the read/write pattern to random writes only.--bs 4ksets the block size of each write to the smallest supported by modern block devices.--runtime 30ssets how long the test should run. 30s is more than enough for accurate statistics.--numjobs 4sets the number of writer threads that FIO will spawn. Don’t set this higher than the number of CPU cores available on your system.--iodepth=32sets the number of unacknowledged IOs each thread can have in-flight. Since we’re attempting to saturate the storage system with IO, set this number high (>16, at least).--group_reportingtells FIO to combine each job/threads (–numjob) statistics into a single report.--rwmixwrite=100sets the read/write mix to 100% write.
In the output you’ll find, write: IOPS=57.3k, that’s our baseline for max IOPS on this storage system. The clat outputs are the cumulative latency baselines for your storage system. Comparing these against results from tests run against the DRBD device will help understand the overhead of synchronous replication.
Issues might crop up after DRBD is already in-use. Luckily, there are some methods you can use to help isolate each subsystem without interrupting services while using DRBD. This can help hone in on where bottlenecks might have cropped up, and therefore help to mitigate them.
A quick way to know whether the network or a specific peer is bottlenecking the performance of a DRBD device is to simply disconnect the Primary DRBD device from it’s peers.
From the Primary node, use the disconnect subcommand to temporarily disconnect DRBD from it’s peers (this temporarily stops replication):
# drbdadm status test0
test0 role:Primary
  disk:UpToDate
  kube-0 role:Secondary
    peer-disk:Diskless
  kube-1 role:Secondary
    peer-disk:UpToDate

# drbdadm disconnect test0

# drbdadm status test0
test0 role:Primary
  disk:UpToDate quorum:no
  kube-0 connection:StandAlone
  kube-1 connection:StandAlone
If the issue exists on the network, or on a peer node, you should see the expected performance has been restored. If performance remains poor, then the issue is likely to be the Primary node’s storage system.
Running the disconnect subcommand above on the peers will tear down the listening socket on that peer, which means it can then be used to test each individual network connection using the dd/netcat method from the network benchmarking KB linked above https://kb.linbit.com/benchmarking-network-throughput, by substituting DRBD’s replication port from the DRBD configuration for TCP port 9919 used in the KB’s examples. Be sure to test each connection in each direction (node-a -> node-b, node-b -> node-a, and so on). If any connection is slower than the rest, that’s the maximum performance your system can achieve.
If the connections all perform as expected, it’s likely to be an issue with the backing disk of a peer.
If the performance remained poor on the Primary after disconnecting the replication to its peers, you’ll want to inspect the Primary’s backing storage using the Advanced Troubleshooting Methods outlined in the section below. Common potential causes of this are RAID batteries needing to be replaced, degraded/rebuilding RAID arrays, some unexpected process consuming IO throughput, or even slow disk failures.
If the performance returned to what is considered normal after disconnecting replication, and the network connections between each performed as expected, you’ll want to inspect the backing storage in each of the peers.
⚠️ WARNING: The following introduces data divergence.
To isolate a specific peer as problematic, you could force DRBD into the
Primary role on a Secondary node, and test performance using the
destructive benchmarking methods mentioned in the sections above. Once
you’ve completed the tests, you can reconnect DRBD from the now
divergent peer using the --discard-my-data command to resolve
the data divergence, and resync the good data from the current Primary
node:
- Disconnect the Secondary node from its peers by running
drbdadm disconnectfrom the Secondary node that you want to test (test0is the DRBD resource name in the example below):
# drbdadm disconnect test0
Force the disconnected Secondary into Primary (drbdsetup command may be
necessary in older DRBD versions):
# drbdsetup resource-options test0 --set-defaults --on-no-quorum=io-error --quorum=off
# drbdadm primary test0 --force
Test your disk performance using any of the methods outlined in the sections above (dd/fio/etc).
Once you’re done testing, you can demote to Secondary, and reconnect the node using the –discard-my-data flag to force it to sync over the garbage created during your tests, and sync any other out-of-sync blocks from the Primary:
# drbdadm secondary test0
# drbdadm connect test0 --discard-my-data
Once you’ve narrowed down where the issue exists, you’ll have a much easier time identifying the root cause. See the links in the Advanced Troubleshooting Methods section for more guidance in identifying issues in computer systems.
If the system is under high load or is slow for other non-obvious reasons, try consulting this diagram for ideas: Linux Performance Checklist.
You should go through steps in the order suggested by this flowchart: Errors, Utilization, Saturation.
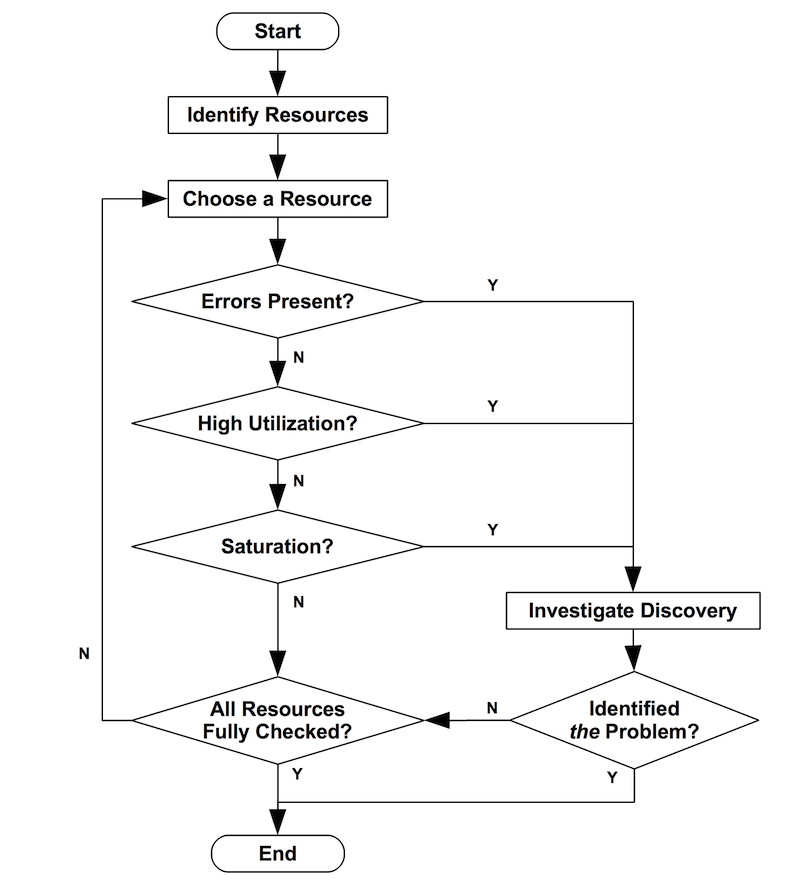
If you have time, it’s worth reading the article concerning this approach: The USE Method.
Edited 2022/02/02 - MDK
Reviewed 2022/02/08 – DJV